[SK] ScouterWelcome to the Scouter Indicator
What you will enjoy the most out of this big combo breaker are the many configuration options that will enable you to play around and explore different ideas that will help you find patterns more easily while keeping a sexy modern aesthetic, in a single indicator selection. The name gets pretty long so you'll want to collapse the indicators list with the dropdown arrow provided underneath it.
Below is the list of the different building blocks of the indicator and the available settings for each.
3Moving Averages -------------------------------
Configuration:
* Toggle On/Off
* Length of data
* Source of data
* 4 Types of averages to choose from:
-- Weighted
-- Exponential
-- Simple
-- Volume Weighted
* Crossovers
-- Moving Average 2
-- Moving Average 3
-- VWAP
-- Source of data
-- OFF to disable
* Color
VWAP --------------------------------------------
Configuration:
* Toggle on/off
* Source of data
* Crossovers
-- Moving Average 1
-- Moving Average 2
-- Moving Average 3
-- Source of data
-- OFF to disable* Color
Action Cloud -----------------------------------
Select 2 plots from the indicators configured to create a filled cloud.
Whenever the bottom edge crosses over the top edge the fill color changes to the 'Down' color.
* Toggle on/off
* Top / Bottom Edge Source
-- Moving Average 1
-- Moving Average 2
-- Moving Average 3
-- VWAP
-- Keltner Boll Midline
-- Bollinger Top
-- Bollinger Bottom
-- Keltner Top
-- Keltner Bottom
* Color Up / Down
Keltner Boll Clouds --------------------------
These are cloud fills that resemble trends or golden areas in the price action.
It's up to interpretation, play around with them and see how useful they can be for your own trading.
North cloud is created from the top of the Bollinger to the Top of the Kernel
South cloud is created from the bottom of the Kernel to the bottom of the Bollinger
Configuration:
* Toggle on/off
* Source of data
* Length of data
* Keltner Multiplier
* Bollinger Deviation
* Cloud style ( Fill, Bands )
* Cloud Transparency
* Show / Hide Midline moving average
* Type of moving average used
* Moving Average Crossovers
ค้นหาในสคริปต์สำหรับ "moving average crossover"
Stockbee 8% 4% 9M + MA CrossoversThis is another version of my Stockbee 9% 4% 9M script, now enhanced with moving average crossovers to highlight trend shifts more effectively.
The crossovers are displayed in the same visual style as the 9 million volume indicator from the original script but use different shapes and forms for better distinction.
All crossover visuals can be customized to your liking—you can adjust their appearance to fit your charting style or preference.

THOR SignalTHOR Signal Indicator
Trend Regime Detection via Volatility-Normalized Acceleration Scoring
The THOR Signal Indicator classifies market direction into “long-favorable” or “short/risk-off” regimes using a three-layer signal process that adapts to volatility, momentum strength, and directional consistency. This script is specifically designed for swing traders looking to reduce false positives during choppy or trendless periods.
⸻
How It Works
THOR does not use standard technical indicators like RSI, MACD, or moving average crossovers. Instead, it creates a composite signal using three custom-calculated conditions:
1. Volatility-Normalized Price Deviation:
• Measures how far price has moved relative to recent volatility.
• Helps distinguish between meaningful trend movement and noise.
2. Directional Acceleration Score:
• Calculates the second derivative (rate of change of momentum) of a smoothed trend backbone.
• Signals regime shifts only when acceleration exceeds a dynamic threshold.
3. Persistence Filter:
• Applies a custom smoothing layer (similar to a Kalman filter) to confirm that directional strength is sustainable and not short-term whipsaw.
• Filters out one-bar momentum spikes.
A signal is plotted only when all three layers agree:
• Green dot = Long-side favorable regime
• Red dot = Short-side or risk-off regime
⸻
Why This Is Different
Unlike standard momentum tools that rely on fixed thresholds (like RSI overbought/oversold levels), THOR dynamically adapts its regime criteria based on the asset’s own behavior. It avoids laggy confirmation signals by using real-time volatility conditioning and trend persistence scoring.
It is not a mashup of public indicators. No MA crossovers, Bollinger Bands, or known oscillator logic is used. The architecture is original and built entirely from low-level functions and mathematical modeling.
⸻
How to Use It
• Best timeframes: Weekly, Daily, or Renko
• Use bar-close confirmation only (do not trade intrabar signals)
• Green dot: Consider long position or hold existing longs
• Red dot: Consider exiting longs or entering defensive stance
• Use with existing risk management and discretionary context
⸻
Use Case
• Swing trade filter
• Trend regime switch detector
• Allocation toggling (risk-on vs risk-off)
⸻
Disclosures
This is a closed-source script. Logic has been explained conceptually to comply with TradingView script publishing policies. No proprietary code is exposed. The tool is not intended as financial advice and does not guarantee accuracy or profitability.

Market Trend Levels Detector [BigBeluga]Market Trend Levels Detector is an trend-following tool that utilizes moving average crossovers to identify key market trend levels. By detecting local highs and lows after EMA crossovers, the indicator helps traders track significant price zones and trend strength.
🔵 Key Features:
EMA Crossover-Based Trend Levels Detection:
Uses a fast and slow EMA to detect market flow shifts.
When the fast EMA crosses under the slow EMA, the indicator searches for the most recent local top and marks it with a label and horizontal level.
When the fast EMA crosses over the slow EMA, it searches for the most recent local low and marks it accordingly.
Dynamic Zone Levels:
Each detected high or low is plotted as a horizontal level, highlighting important price zones.
Traders can extend these levels to observe how price interacts with them over time.
If price crosses a level, its extension stops. Uncrossed levels continue expanding.
Gradient Trend Band Visualization:
The trend band is formed by shading the area between the two EMAs.
Color intensity varies based on volatility and trend strength.
Strong trends and high volatility areas appear with more intense colors, making trend shifts visually distinct.
🔵 Usage:
Trend Identification: Use EMA crossovers and trend bands to confirm bullish or bearish momentum.
Key Zone Mapping: Observe local high/low levels to track historical reaction points.
Breakout & Rejection Signals: Monitor price interactions with extended levels to assess potential breakouts or reversals.
Volatility Strength Analysis: Use color intensity in the trend band to gauge trend power and possible exhaustion points.
Scalping & Swing Trading: Ideal for both short-term scalping strategies and larger swing trade setups.
Market Trend Levels Detector is a must-have tool for traders looking to track market flow, key price levels, and trend momentum with dynamic visual cues. It provides a comprehensive approach to identifying high-probability trade setups using EMA-based flow detection and trend analysis.

Adaptive Trend Classification: Moving Averages [InvestorUnknown]Adaptive Trend Classification: Moving Averages
Overview
The Adaptive Trend Classification (ATC) Moving Averages indicator is a robust and adaptable investing tool designed to provide dynamic signals based on various types of moving averages and their lengths. This indicator incorporates multiple layers of adaptability to enhance its effectiveness in various market conditions.
Key Features
Adaptability of Moving Average Types and Lengths: The indicator utilizes different types of moving averages (EMA, HMA, WMA, DEMA, LSMA, KAMA) with customizable lengths to adjust to market conditions.
Dynamic Weighting Based on Performance: ] Weights are assigned to each moving average based on the equity they generate, with considerations for a cutout period and decay rate to manage (reduce) the influence of past performances.
Exponential Growth Adjustment: The influence of recent performance is enhanced through an adjustable exponential growth factor, ensuring that more recent data has a greater impact on the signal.
Calibration Mode: Allows users to fine-tune the indicator settings for specific signal periods and backtesting, ensuring optimized performance.
Visualization Options: Multiple customization options for plotting moving averages, color bars, and signal arrows, enhancing the clarity of the visual output.
Alerts: Configurable alert settings to notify users based on specific moving average crossovers or the average signal.
User Inputs
Adaptability Settings
λ (Lambda): Specifies the growth rate for exponential growth calculations.
Decay (%): Determines the rate of depreciation applied to the equity over time.
CutOut Period: Sets the period after which equity calculations start, allowing for a focus on specific time ranges.
Robustness Lengths: Defines the range of robustness for equity calculation with options for Narrow, Medium, or Wide adjustments.
Long/Short Threshold: Sets thresholds for long and short signals.
Calculation Source: The data source used for calculations (e.g., close price).
Moving Averages Settings
Lengths and Weights: Allows customization of lengths and initial weights for each moving average type (EMA, HMA, WMA, DEMA, LSMA, KAMA).
Calibration Mode
Calibration Mode: Enables calibration for fine-tuning inputs.
Calibrate: Specifies which moving average type to calibrate.
Strategy View: Shifts entries and exits by one bar for non-repainting backtesting.
Calculation Logic
Rate of Change (R): Calculates the rate of change in the price.
Set of Moving Averages: Generates multiple moving averages with different lengths for each type.
diflen(length) =>
int L1 = na, int L_1 = na
int L2 = na, int L_2 = na
int L3 = na, int L_3 = na
int L4 = na, int L_4 = na
if robustness == "Narrow"
L1 := length + 1, L_1 := length - 1
L2 := length + 2, L_2 := length - 2
L3 := length + 3, L_3 := length - 3
L4 := length + 4, L_4 := length - 4
else if robustness == "Medium"
L1 := length + 1, L_1 := length - 1
L2 := length + 2, L_2 := length - 2
L3 := length + 4, L_3 := length - 4
L4 := length + 6, L_4 := length - 6
else
L1 := length + 1, L_1 := length - 1
L2 := length + 3, L_2 := length - 3
L3 := length + 5, L_3 := length - 5
L4 := length + 7, L_4 := length - 7
// Function to calculate different types of moving averages
ma_calculation(source, length, ma_type) =>
if ma_type == "EMA"
ta.ema(source, length)
else if ma_type == "HMA"
ta.sma(source, length)
else if ma_type == "WMA"
ta.wma(source, length)
else if ma_type == "DEMA"
ta.dema(source, length)
else if ma_type == "LSMA"
lsma(source,length)
else if ma_type == "KAMA"
kama(source, length)
else
na
// Function to create a set of moving averages with different lengths
SetOfMovingAverages(length, source, ma_type) =>
= diflen(length)
MA = ma_calculation(source, length, ma_type)
MA1 = ma_calculation(source, L1, ma_type)
MA2 = ma_calculation(source, L2, ma_type)
MA3 = ma_calculation(source, L3, ma_type)
MA4 = ma_calculation(source, L4, ma_type)
MA_1 = ma_calculation(source, L_1, ma_type)
MA_2 = ma_calculation(source, L_2, ma_type)
MA_3 = ma_calculation(source, L_3, ma_type)
MA_4 = ma_calculation(source, L_4, ma_type)
Exponential Growth Factor: Computes an exponential growth factor based on the current bar index and growth rate.
// The function `e(L)` calculates an exponential growth factor based on the current bar index and a given growth rate `L`.
e(L) =>
// Calculate the number of bars elapsed.
// If the `bar_index` is 0 (i.e., the very first bar), set `bars` to 1 to avoid division by zero.
bars = bar_index == 0 ? 1 : bar_index
// Define the cuttime time using the `cutout` parameter, which specifies how many bars will be cut out off the time series.
cuttime = time
// Initialize the exponential growth factor `x` to 1.0.
x = 1.0
// Check if `cuttime` is not `na` and the current time is greater than or equal to `cuttime`.
if not na(cuttime) and time >= cuttime
// Use the mathematical constant `e` raised to the power of `L * (bar_index - cutout)`.
// This represents exponential growth over the number of bars since the `cutout`.
x := math.pow(math.e, L * (bar_index - cutout))
x
Equity Calculation: Calculates the equity based on starting equity, signals, and the rate of change, incorporating a natural decay rate.
pine code
// This function calculates the equity based on the starting equity, signals, and rate of change (R).
eq(starting_equity, sig, R) =>
cuttime = time
if not na(cuttime) and time >= cuttime
// Calculate the rate of return `r` by multiplying the rate of change `R` with the exponential growth factor `e(La)`.
r = R * e(La)
// Calculate the depreciation factor `d` as 1 minus the depreciation rate `De`.
d = 1 - De
var float a = 0.0
// If the previous signal `sig ` is positive, set `a` to `r`.
if (sig > 0)
a := r
// If the previous signal `sig ` is negative, set `a` to `-r`.
else if (sig < 0)
a := -r
// Declare the variable `e` to store equity and initialize it to `na`.
var float e = na
// If `e ` (the previous equity value) is not available (first calculation):
if na(e )
e := starting_equity
else
// Update `e` based on the previous equity value, depreciation factor `d`, and adjustment factor `a`.
e := (e * d) * (1 + a)
// Ensure `e` does not drop below 0.25.
if (e < 0.25)
e := 0.25
e
else
na
Signal Generation: Generates signals based on crossovers and computes a weighted signal from multiple moving averages.
Main Calculations
The indicator calculates different moving averages (EMA, HMA, WMA, DEMA, LSMA, KAMA) and their respective signals, applies exponential growth and decay factors to compute equities, and then derives a final signal by averaging weighted signals from all moving averages.
Visualization and Alerts
The final signal, along with additional visual aids like color bars and arrows, is plotted on the chart. Users can also set up alerts based on specific conditions to receive notifications for potential trading opportunities.
Repainting
The indicator does support intra-bar changes of signal but will not repaint once the bar is closed, if you want to get alerts only for signals after bar close, turn on “Strategy View” while setting up the alert.
Conclusion
The Adaptive Trend Classification: Moving Averages Indicator is a sophisticated tool for investors, offering extensive customization and adaptability to changing market conditions. By integrating multiple moving averages and leveraging dynamic weighting based on performance, it aims to provide reliable and timely investing signals.

AMASling - All Moving Average Sling ShotThis indicator modifies the SlingShot System by Chris Moody to allow it to be based on 'any' Fast and Slow moving average pair. Open Long / Close Long / Open Short / Close Short alerts can be generated for automated bot trading based on the SlingShot strategy:
• Conservative Entry = Fast MA above Slow MA, and previous bar close below Fast MA, and current price above Fast MA
• Conservative Entry = Fast MA below Slow MA, and previous bar close above Fast MA, and current price below Fast MA
• Aggressive Entry = Fast MA above Slow MA, and price below Fast MA
• Aggressive Exit = Fast MA below Slow MA, and price above Fast MA
Entries and exits can also be made based on moving average crossovers, I initially put this in to make it easy to compare to a more standard strategy, but upon backtesting combining crossovers with the SlingShot appeared to produce better results on some charts.
Alerts can also be filtered to allow long deals only when the fast moving average is above the slow moving average (uptrend) and short deals only when the fast moving average is below the slow moving averages (downtrend).
If you have a strategy that can buy based on External Indicators you can use the 'Backtest Signal' which plots the values set in the 'Long / Short Signals' section.
The Fast, Slow and Signal Moving Averages can be set to:
• Simple Moving Average (SMA)
• Exponential Moving Average (EMA)
• Weighted Moving Average (WMA)
• Volume-Weighted Moving Average (VWMA)
• Hull Moving Average (HMA)
• Exponentially Weighted Moving Average (RMA) (SMMA)
• Linear regression curve Moving Average (LSMA)
• Double EMA (DEMA)
• Double SMA (DSMA)
• Double WMA (DWMA)
• Double RMA (DRMA)
• Triple EMA (TEMA)
• Triple SMA (TSMA)
• Triple WMA (TWMA)
• Triple RMA (TRMA)
• Symmetrically Weighted Moving Average (SWMA) ** length does not apply **
• Arnaud Legoux Moving Average (ALMA)
• Variable Index Dynamic Average (VIDYA)
• Fractal Adaptive Moving Average (FRAMA)
'Backtest Signal' and 'Deal State' are plotted to display.none, so change the Style Settings for the chart if you need to see them for testing.
Yes I did choose the name because 'It's Amasling!'

DarkPool FlowDarkPool Flow is a professional-grade technical analysis tool designed to align retail traders with the dominant "smart money" flow. Unlike standard moving average crossovers that often generate false signals during consolidation, this script employs a multi-layered filtering engine to isolate high-probability trends.
The core philosophy of this indicator is that Trends are fractal. A sustainable move on a lower timeframe must be supported by momentum on a higher timeframe. By comparing a "Fast Signal Trend" against a "Slow Anchor Trend" (e.g., Daily vs. Weekly), the script identifies the market bias used by institutional algorithms.
This edition features a Smart Recovery Engine, ensuring that valid trends are not missed simply because momentum started slowly, and a Dynamic Cloud that visually represents the strength of the trend spread.
Key Features
1. Auto-Adaptive Timeframe Logic
The script eliminates the guesswork of Multi-Timeframe (MTF) selection. By enabling "Auto-Adapt," the indicator detects your current chart timeframe and automatically maps it to the mathematically correct institutional pairings:
Scalping (<15m): Uses 15-Minute Trend vs. 1-Hour Anchor.
Day Trading (15m - 1H): Uses 4-Hour Trend vs. Daily Anchor.
Swing Trading (4H - Daily): Uses Daily Trend vs. Weekly Anchor (The classic "Golden" setup).
Investing (Weekly): Uses 21-Week EMA vs. 50-Week SMA (Bull Market Support Band logic).
2. Smart Recovery Signal Engine
Standard crossover scripts often miss major moves if the specific breakout candle has low volume or weak ADX. This script utilizes a state-machine logic that "remembers" the trend direction. If a trend begins during low volatility (gray candles), the script waits. The moment volatility and momentum confirm the move, a Smart Recovery Signal is triggered, allowing you to enter an existing trend safely.
3. Chop Protection (Gray Candles)
Preservation of capital is the priority. The script analyzes the Average Directional Index (ADX) and Volatility (ATR).
Colored Candles (Green/Red): The market is trending with sufficient strength. Trading is permitted.
Gray Candles: The market is in a low-energy chop or consolidation (ADX < 20). Trading is discouraged.
4. Dynamic Trend Cloud
The space between the Fast and Slow trends is filled with a dynamic cloud.
Darker/Opaque Cloud: Indicates a widening spread, suggesting accelerating momentum.
Lighter/Transparent Cloud: Indicates a narrowing spread, suggesting the trend may be weakening or consolidating.
5. Pullback & Retest Signals (+)
While triangles mark the start of a trend, the Plus (+) signs mark low-risk opportunities to add to a position. These appear when price dips into the cloud, finds support at the "Fair Value" zone, and closes back in the direction of the trend with confirmed momentum.
User Guide & Strategy
Setup
Add the indicator to your chart.
For Beginners: Enable "Auto-Adaptive Timeframes" in the settings.
For Advanced Users: Disable Auto-Adapt and manually configure your Fast/Slow pairings (Default is Daily 50 EMA / Weekly 50 EMA).
Signal Mode: Choose "First Breakout Only" for a cleaner chart, or "All Signals" if you wish to see re-entry points during choppy starts.
Long Entry Criteria (Buy)
Trend: The Cloud must be Green (Fast Trend > Slow Trend).
Signal: A Green Triangle appears below the bar.
Confirmation: The signal candle must not be Gray.
Re-Entry: A small Green (+) sign appears, indicating a successful test of the cloud support.
Short Entry Criteria (Sell)
Trend: The Cloud must be Red (Fast Trend < Slow Trend).
Signal: A Red Triangle appears above the bar.
Confirmation: The signal candle must not be Gray.
Re-Entry: A small Red (+) sign appears, indicating a successful test of the cloud resistance.
Stop Loss & Risk Management
Stop Loss: A standard institutional stop loss is placed just beyond the Slow Trend Line (the outer edge of the cloud). If price closes beyond the Slow Trend, the macro thesis is invalid.
Take Profit: Target liquidity pools or use a trailing stop based on the Fast Trend line.
Settings Overview
Mode Selection: Toggle between Auto-Adaptive logic or Manual control.
Manual Configuration: Define the specific Timeframe, Length, and Type (EMA, SMA, WMA) for both Fast and Slow trends.
Signal Logic: Toggle "Show Pullback Signals" on/off. Switch between "First Breakout" or "All Signals."
Quality Filters: Toggle individual filters (ATR, RSI, ADX) to adjust sensitivity. Turning these off makes the script more responsive but increases false signals.
Visual Style: Customize colors for Bullish, Bearish, and Neutral (Gray) states. Adjust cloud transparency.
Disclaimer
Risk Warning: Trading financial markets involves a high degree of risk and is not suitable for all investors. You could lose some or all of your initial investment.
Educational Use Only: This script and the information provided herein are for educational and informational purposes only. They do not constitute financial advice, investment advice, trading advice, or any other recommendation.
No Guarantee: Past performance of any trading system or methodology is not necessarily indicative of future results. The "Institutional Trend" indicator is a tool to assist in technical analysis, not a crystal ball. The creators of this script assume no responsibility or liability for any trading losses or damages incurred as a result of using this tool. Always perform your own due diligence and consult with a qualified financial advisor before making investment decisions.

Multi-Timeframe EMA Trend Dashboard with Volume and RSI Filters═══════════════════════════════════════════════════════════
MULTI-TIMEFRAME EMA TREND DASHBOARD
═══════════════════════════════════════════════════════════
OVERVIEW
This indicator provides a comprehensive view of trend direction across multiple timeframes using the classic EMA 20/50 crossover methodology, enhanced with volume confirmation and RSI filtering. It aggregates trend information from six timeframes into a single dashboard for efficient market analysis.
The indicator is designed for educational purposes and to assist traders in identifying potential trend alignments across different time horizons.
═══════════════════════════════════════════════════════════
FEATURES
═══════════════════════════════════════════════════════════
MULTI-TIMEFRAME ANALYSIS
• Monitors 6 timeframes simultaneously: 1m, 5m, 15m, 1H, 4H, 1D
• Each timeframe analyzed independently using request.security()
• Non-repainting implementation with proper lookahead settings
• Calculates overall trend strength as percentage of bullish timeframes
EMA CROSSOVER SYSTEM
• Fast EMA (default: 20) and Slow EMA (default: 50)
• Bullish: Fast EMA > Slow EMA
• Bearish: Fast EMA < Slow EMA
• Neutral: Fast EMA = Slow EMA (rare condition)
• Visual EMA plots with optional fill area
VOLUME CONFIRMATION
• Optional volume filter for crossover signals
• Compares current volume against moving average (default: 20-period SMA)
• Categorizes volume as: High (>1.5x average), Normal (>average), Low (70), oversold (<30), and neutral zones
• Used in quality score calculation
• Optional display toggle
SUPPORT & RESISTANCE DETECTION
• Automatic detection using highest/lowest over lookback period (default: 50 bars)
• Plots resistance (red), support (green), and mid-level (gray)
• Step-line style for clear visualization
• Optional display toggle
QUALITY SCORING SYSTEM
• Rates trade setups from 1-5 stars
• Considers: MTF alignment, volume confirmation, RSI positioning
• 5 stars: 4+ timeframes aligned + volume confirmed + RSI 50-70
• 4 stars: 4+ timeframes aligned + volume confirmed
• 3 stars: 3+ timeframes aligned
• 2 stars: Exactly 3 timeframes aligned
• 1 star: Other conditions
VISUAL DASHBOARD
• Clean table display (position customizable)
• Color-coded trend indicators (green/red/yellow)
• Extended statistics panel (toggleable)
• Shows: Trends, Strength, Quality, RSI, Volume, Price Distance
═══════════════════════════════════════════════════════════
TECHNICAL SPECIFICATIONS
═══════════════════════════════════════════════════════════
CALCULATIONS
Trend Determination per Timeframe:
• request.security() fetches EMA values with gaps=off, lookahead=off
• Compares Fast EMA vs Slow EMA
• Returns: 1 (bullish), -1 (bearish), 0 (neutral)
Trend Strength:
• Counts number of bullish timeframes
• Formula: (bullish_count / 6) × 100
• Range: 0% (all bearish) to 100% (all bullish)
Price Distance from EMA:
• Formula: ((close - EMA) / EMA) × 100
• Positive: Price above EMA
• Negative: Price below EMA
• Warning when absolute distance > 5%
ANTI-REPAINTING MEASURES
• All request.security() calls use lookahead=barmerge.lookahead_off
• Dashboard updates only on barstate.islast
• Historical bars remain unchanged
• Crossover signals finalize on bar close
═══════════════════════════════════════════════════════════
USAGE GUIDE
═══════════════════════════════════════════════════════════
INTERPRETING THE DASHBOARD
Timeframe Rows:
• Each row shows individual timeframe trend status
• Look for alignment (multiple timeframes same direction)
• Higher timeframes generally more significant
Strength Indicator:
• >66.67%: Strong bullish (4+ timeframes bullish)
• 33.33-66.67%: Mixed/choppy conditions
• <33.33%: Strong bearish (4+ timeframes bearish)
Quality Score:
• Higher stars = better confluence of factors
• 5-star setups have strongest multi-factor confirmation
• Lower scores may indicate weaker or conflicting signals
SUGGESTED APPLICATIONS
Trend Confirmation:
• Check if multiple timeframes confirm current chart trend
• Higher agreement = stronger trend confidence
• Use for position sizing decisions
Entry Timing:
• Wait for EMA crossover on chart timeframe
• Confirm with higher timeframe alignment
• Volume above average preferred
• RSI not in extreme zones
Divergence Detection:
• When lower timeframes diverge from higher
• May indicate trend exhaustion or reversal
• Requires additional confirmation
CUSTOMIZATION
EMA Settings:
• Adjust Fast/Slow lengths for different sensitivities
• Shorter periods = more responsive, more signals
• Longer periods = smoother, fewer signals
• Common alternatives: 10/30, 12/26, 50/200
Volume Filter:
• Enable for higher-quality signals (fewer false positives)
• Disable in always-liquid markets or for more signals
• Adjust MA length based on typical volume patterns
Display Options:
• Toggle EMAs, S/R levels, extended stats as needed
• Choose dashboard position to avoid chart overlap
• Adjust colors for visibility preferences
═══════════════════════════════════════════════════════════
ALERTS
═══════════════════════════════════════════════════════════
AVAILABLE ALERT CONDITIONS
1. Bullish EMA Cross (Volume Confirmed)
2. Bearish EMA Cross (Volume Confirmed)
3. Strong Bullish Alignment (4+ timeframes)
4. Strong Bearish Alignment (4+ timeframes)
5. Trend Strength Increasing (>16.67% jump)
6. Trend Strength Decreasing (>16.67% drop)
7. Excellent Trade Setup (5-star rating)
Alert messages use standard placeholders:
• {{ticker}} - Symbol name
• {{close}} - Current close price
• {{time}} - Bar timestamp
═══════════════════════════════════════════════════════════
LIMITATIONS & CONSIDERATIONS
═══════════════════════════════════════════════════════════
KNOWN LIMITATIONS
• Lower timeframe data may not be available on all symbols
• 1-minute data typically limited to recent history
• request.security() subject to TradingView data limits
• Dashboard requires screen space (may overlap on small screens)
• More complex calculations may affect load time on slower devices
NOT SUITABLE FOR
• Highly volatile/illiquid instruments (many false signals)
• News-driven markets during announcements
• Automated trading without additional filters
• Markets where EMA strategies don't perform well
DOES NOT PROVIDE
• Exact entry/exit prices
• Stop-loss or take-profit levels
• Position sizing recommendations
• Guaranteed profit signals
• Market predictions
═══════════════════════════════════════════════════════════
BEST PRACTICES
═══════════════════════════════════════════════════════════
RECOMMENDED USAGE
✓ Combine with price action analysis
✓ Use appropriate risk management
✓ Backtest on historical data before live use
✓ Adjust settings for specific market characteristics
✓ Wait for higher-quality setups in important trades
✓ Consider overall market context and fundamentals
NOT RECOMMENDED
✗ Using as standalone trading system without confirmation
✗ Trading every signal without discretion
✗ Ignoring risk management principles
✗ Trading without understanding the methodology
✗ Applying to unsuitable markets/timeframes
═══════════════════════════════════════════════════════════
EDUCATIONAL BACKGROUND
═══════════════════════════════════════════════════════════
EMA CROSSOVER STRATEGY
The Exponential Moving Average crossover is a classical trend-following technique:
• Golden Cross: Fast EMA crosses above Slow EMA (bullish signal)
• Death Cross: Fast EMA crosses below Slow EMA (bearish signal)
• Widely used since the 1970s in various markets
• More responsive than SMA due to exponential weighting
MULTI-TIMEFRAME ANALYSIS
Analyzing multiple timeframes helps traders:
• Identify alignment between short and long-term trends
• Reduce false signals from single-timeframe noise
• Understand market context across different horizons
• Make informed decisions about trade duration
VOLUME ANALYSIS
Volume confirmation adds reliability:
• High volume suggests institutional participation
• Low volume signals may indicate false breakouts
• Volume precedes price in many market theories
• Helps distinguish genuine moves from noise
═══════════════════════════════════════════════════════════
TECHNICAL IMPLEMENTATION
═══════════════════════════════════════════════════════════
CODE STRUCTURE
• Organized in clear sections with proper commenting
• Uses explicit type declarations (int, float, bool, color, string)
• Constants defined at top (BULLISH=1, BEARISH=-1, etc.)
• Functions documented with @function, @param, @returns
• Follows PineCoders naming conventions (camelCase variables)
PERFORMANCE OPTIMIZATION
• var keyword for table (created once, not every bar)
• Calculations cached where possible
• Dashboard updates only on last bar
• Minimal redundant security() calls
SECURITY IMPLEMENTATION
• Proper gaps and lookahead parameters
• No future data leakage
• Signals finalize on bar close
• Historical bars remain static
═══════════════════════════════════════════════════════════
VERSION INFORMATION
═══════════════════════════════════════════════════════════
Current Version: 2.0
Pine Script Version: 5
Last Updated: 2024
Developed by: Zakaria Safri
═══════════════════════════════════════════════════════════
SETTINGS REFERENCE
═══════════════════════════════════════════════════════════
EMA SETTINGS
• Fast EMA Length: 1-500 (default: 20)
• Slow EMA Length: 1-500 (default: 50)
VOLUME & MOMENTUM
• Use Volume Confirmation: true/false (default: true)
• Volume MA Length: 1-500 (default: 20)
• Show RSI Levels: true/false (default: true)
• RSI Length: 1-500 (default: 14)
PRICE ACTION FEATURES
• Show Price Distance: true/false (default: true)
• Show Key Levels: true/false (default: true)
• S/R Lookback Period: 10-500 (default: 50)
DISPLAY SETTINGS
• Show EMAs on Chart: true/false (default: true)
• Fast EMA Color: customizable (default: cyan)
• Slow EMA Color: customizable (default: orange)
• EMA Line Width: 1-5 (default: 2)
• Show Fill Between EMAs: true/false (default: true)
• Show Crossover Signals: true/false (default: true)
DASHBOARD SETTINGS
• Position: Top Left/Right, Bottom Left/Right
• Show Extended Statistics: true/false (default: true)
ALERT SETTINGS
• Alert on Multi-TF Alignment: true/false (default: true)
• Alert on Trend Strength Change: true/false (default: true)
═══════════════════════════════════════════════════════════
RISK DISCLAIMER
═══════════════════════════════════════════════════════════
This indicator is provided for educational and informational purposes only. It should not be considered financial advice or a recommendation to buy or sell any security.
IMPORTANT NOTICES:
• Past performance does not indicate future results
• All trading involves risk of capital loss
• No indicator guarantees profitable trades
• Always conduct independent research and analysis
• Use proper risk management and position sizing
• Consult a qualified financial advisor before trading
• The developer assumes no liability for trading losses
By using this indicator, you acknowledge that you understand these risks and accept full responsibility for your trading decisions.
═══════════════════════════════════════════════════════════
SUPPORT & CONTRIBUTIONS
═══════════════════════════════════════════════════════════
FEEDBACK WELCOME
• Constructive comments appreciated
• Bug reports help improve the indicator
• Feature suggestions considered for future versions
• Share your experience to help other users
OPEN SOURCE
This code is published as open source for the TradingView community to:
• Learn from the implementation
• Modify for personal use
• Understand multi-timeframe analysis techniques
If you find this indicator useful, please consider:
• Leaving a thoughtful review
• Sharing with other traders who might benefit
• Following for future updates and releases
═══════════════════════════════════════════════════════════
ADDITIONAL RESOURCES
═══════════════════════════════════════════════════════════
RECOMMENDED READING
• TradingView Pine Script documentation
• PineCoders community resources
• Technical analysis textbooks on moving averages
• Multi-timeframe trading strategy guides
• Risk management principles
RELATED CONCEPTS
• Trend following strategies
• Moving average convergence/divergence
• Multiple timeframe analysis
• Volume-price relationships
• Momentum indicators
═══════════════════════════════════════════════════════════
Thank you for using this indicator. Trade responsibly and continue learning!
═══════════════════════════════════════════════════════════

2MA Cross with Glow Effects 2MA Cross with Glow Effects
Overview
This indicator enhances the classic moving average crossover strategy with a dynamic and visually appealing "glow" effect. It plots two customisable moving averages on the chart and illuminates the area around them when a crossover occurs, providing a clear and intuitive signal for potential trend changes.
Features
Dual Moving Averages: Configure two independent moving averages to suit your trading style.
Multiple MA Types: Choose from a wide range of moving average types for each line, including:
SMA (Simple Moving Average)
EMA (Exponential Moving Average)
WMA (Weighted Moving Average)
VWMA (Volume-Weighted Moving Average)
RMA (Relative Moving Average)
HMA (Hull Moving Average)
ALMA (Arnaud Legoux Moving Average)
LSMA (Least Squares Moving Average)
Customisable Appearance: Adjust the length, line width, and color for each moving average.
Unique Glow Effect: A configurable glow appears around the moving averages during a crossover, providing an unmistakable visual cue. You can control the intensity and width of this effect.
How It Works
The core of the indicator is the calculation of two moving averages based on the user's selected type and length. The script continuously monitors the relationship between these two MAs.
The "glow" is a sophisticated visual effect achieved by using Pine Script's `fill()` function to create a smooth, colored gradient around the MA lines. The glow is conditionally rendered:
When the first moving average (MA1) crosses above the second (MA2), MA1 will glow above its line.
When MA1 crosses below MA2, it will glow below its line.
The same logic is applied to MA2, creating a dual-glow effect that clearly shows which MA is dominant.
To ensure a consistent visual appearance across different chart timeframes, the indicator incorporates a `tfMultiplier` that automatically adjusts the glow's width.
How to Use
This indicator can be used in the same way as a standard moving average crossover strategy
Bullish Signal: Look for the shorter-period moving average to cross above the longer-period moving average. The glow effect will make this event highly visible.
Bearish Signal: Look for the shorter-period moving average to cross below the longer-period moving average.
Traders can use this for trend identification, entry/exit signals, and as a component of a more comprehensive trading system. For example, a common setup is using a 20-period EMA and a 50-period EMA to capture medium-term trends.
Disclaimer
This indicator is designed as a technical analysis tool and should be used in conjunction with other forms of analysis and proper risk management.
Past performance does not guarantee future results, and traders should thoroughly test any strategy before implementing it with real capital.

MA cross X MAdiff<>atrfilter)📈 MA cross X MAdiff<>ATR filter
Smarter Trend Confirmation Using Adaptive Volatility Thresholds
🔍 What It Does
This indicator upgrades classic moving average crossovers by adding volatility awareness via ATR filtering. Instead of reacting to every small crossover, it waits for the distance between two moving averages to exceed a volatility-adjusted threshold, making signals more meaningful and less noisy.
⚙️ Core Logic
Calculates the difference between a Fast MA and a Slow MA.
Uses Average True Range (ATR) as a dynamic volatility filter.
Confirms trend only when MA difference exceeds:
diff > ATR × multiplier → Bullish
diff < -ATR × multiplier → Bearish
Otherwise: Neutral (gray zone)
The gray zone avoids false signals by detecting indecision or choppy markets.
🧠 Customizable Inputs
Choose any MA type independently for Fast and Slow:
SMA, EMA, WMA, VWMA, RMA, DEMA, TEMA, LSMA, Kijun
Control sensitivity via:
ATR Length
ATR Multiplier
✅ Why It Works
Reduces fake outs in ranging markets.
Adapts to volatility automatically.
Fully customizable for any asset or style.
Ideal for trend traders, momentum entries, or as a confluence layer.
Simplest Strategy Crossover with Labels Buy/Sell to $1000This Pine Script code, titled Custom Moving Average Crossover with Labels, is a trading indicator developed for the TradingView platform. It enables traders to visualize potential buy and sell signals based on the crossover of two moving averages, offering customizable settings for enhanced flexibility. Here’s a breakdown of its key features:
Key Features
User-Defined Moving Averages:
The script includes two moving averages: a fast and a slow one. Users can adjust the periods of each average (default values are 10 for the fast MA and 100 for the slow MA), allowing them to adapt the indicator to various market conditions and trading styles.
Time-Restricted Signal Validity:
The indicator includes settings for active trading hours, defined in UTC time. Users specify a start and end hour, making it possible to limit buy and sell signals to certain times of the day. This is especially useful for traders who wish to avoid signals outside their preferred trading hours or during periods of high volatility.
Crossover-Based Buy and Sell Signals:
Buy Signal: A "Buy" label is triggered and displayed when the fast moving average crosses above the slow moving average within the user-defined trading hours, signifying a potential upward trend.
Sell Signal: A "Sell" label is generated when the fast moving average crosses below the slow moving average, indicating a possible downtrend. Labels are displayed on the chart, color-coded for easy identification: green for buys and red for sells.
Profit Target Labels (+100 Points):
After each buy or sell entry, the indicator tracks price movements. When the price increases by 100 points from a buy entry or decreases by 100 points from a sell entry, a +100 label appears to signify a 100-point movement.
These labels serve as checkpoints to help traders assess performance and decide on further actions, such as taking profits or adjusting stop losses.
Visual Customization:
The moving averages are color-coded (blue for fast MA, red for slow MA) for easy distinction, and label text appears in white to enhance visibility against various chart backgrounds.
Benefits for Traders
Efficient Trade Identification: The moving average crossover combined with time-based restrictions allows traders to capture key market trends within chosen hours.
Clear Profit Checkpoints: The +100 point label alerts traders to significant price movement, useful for those looking for set profit targets.
Flexibility: Customizable inputs give users control over the indicator’s behavior, making it suitable for both day trading and swing trading.
This indicator is designed for traders looking to enhance their technical analysis with reliable, user-defined buy/sell signals, helping to increase confidence and improve trade timing based on objective data.

D_Rock's MA IndicatorD_Rock's Moving Average Indicator
This is an indicator version of my strategy linked here
**Overview:**
The basic concept of this indicator is to generate a signal when a faster/shorter length moving average crosses over (for Longs) or crosses under (for Shorts) a medium/longer length moving average. All of which are customizable. This indicator can work on any timeframe, however the daily is the timeframe used for the default settings and screenshots, as it was designed to be a multi-day swing strategy. Once a signal has been confirmed with a candle close, based on user options, the strategy is to enter the trade on the open of the next candle.
The crossover strategy is nothing new to trading, but what can make this strategy unique and helpful, is the addition of further confirmation points before a signal is generated along with the ability to show multiple moving averages on the chart if you choose. Each moving average pair can also be turned into a "cloud" instead of the traditional lines, for additional viewing preferences. Just about everything visual can be toggled on/off as well.
This indicator is a Trend (MA) indicator with optional confirmation points using a Momentum (MACD) indicator. While a Volume-based indicator is not shown here, one could consider using their favorite from that category to further compliment the signal idea.
If you would like to see the backtesting results for your favorite moving average crossover/under, please see my strategy version linked here .
Shoutout given to Ripster's Clouds Indicator as pieces of that code were taken and modified to create both the Cloud visualization effects, and the Moving Average Pair Plots that are implemented in this strategy.
MOVING AVERAGE OPTIONS
Select between and change the length & type of up to 5 pairs (10 total) of moving averages
The "Show Cloud-x" option will display a fill color between the "a" and "b" pairs
All moving averages lines can be toggled on/off in the "Style" tab, as well as adjusting their colors.
Visualization features do not affect calculations, meaning you could have all or nothing on the chart and the strategy will still produce results
SIGNAL CHOICES
Choose the fast/shorter length MA and the medium/longer length MA to determine the entry signal
CONFIRMATION OPTIONS
Both of these have customizable values and can be toggled on/off
A candle close over a slower/much longer length moving average
An additional cross-over (cross-under for Shorts) on the MACD indicator using default MACD values. While the MACD indicator is not necessary to have on the chart, it can help to add that for visualization. The calculations will perform whether the indicator is on the chart or not.
ADDITIONAL PLOTS
MACD (Moving Average Convergence/Divergence):
- The MACD is an optional confirmation indicator for this strategy.
- Plotting the indicator is not necessary for the strategy to work, but it can be helpful to visually see the status and position of the MACD if this feature is enabled in the strategy
- This helps to identify if there is also momentum behind the entry signal
RSI based MAGot it! Here’s some information in English specifically about the **RSI-based Moving Average (RSI-based MA)** that we wrote the Pine Script code for:
### RSI-Based Moving Average (RSI-based MA)
An **RSI-based Moving Average (RSI-based MA)** is a technical analysis tool that combines the Relative Strength Index (RSI) with moving averages to provide more insight into market trends and potential reversals. This indicator can be particularly useful for identifying the beginning and end of trends, allowing traders to make more informed decisions.
### How RSI-based MA Works
The RSI-based MA indicator calculates the moving average of the RSI values rather than the asset's price itself. In the script you asked for, we implemented two RSI-based moving averages: one for a 1-minute timeframe and another for a 5-minute timeframe. This dual timeframe approach can help traders spot trends more accurately and identify shifts in momentum across different time periods.
#### Key Features of RSI-based MA:
1. **Dual Timeframe Analysis**:
- The script plots two RSI-based moving averages on the same chart:
- **1-minute RSI-based MA**: A moving average calculated based on RSI values over a 1-minute interval.
- **5-minute RSI-based MA**: A moving average calculated based on RSI values over a 5-minute interval.
- Using different timeframes helps traders see both short-term and longer-term trends simultaneously.
2. **RSI Levels**:
- The RSI-based MA plots values between 0 and 100, similar to the RSI itself. Traders can use typical RSI levels, such as 70 (overbought) and 30 (oversold), to identify potential entry and exit points.
- **Overbought condition**: When the RSI-based MA moves above 70, it indicates the asset might be overbought, suggesting a potential for price to drop.
- **Oversold condition**: When the RSI-based MA drops below 30, it signals that the asset might be oversold, indicating a potential price increase.
3. **Crossovers**:
- **Bullish signal**: If the shorter 1-minute RSI-based MA crosses above the longer 5-minute RSI-based MA, this could indicate a new upward trend beginning.
- **Bearish signal**: Conversely, if the 1-minute RSI-based MA crosses below the 5-minute RSI-based MA, it could suggest the beginning of a downward trend.
### Potential Advantages
- **Smoother Trend Identification**: By applying moving averages to RSI, you can smooth out the short-term fluctuations in RSI values, making it easier to identify the underlying trend.
- **Versatility**: The indicator can be customized for different timeframes and settings, allowing it to be tailored to various trading strategies and asset classes.
- **Enhanced Signals**: Combining RSI and moving averages helps filter out noise, providing more reliable signals for potential trend changes or continuations.
### Potential Limitations
- **Lagging Indicator**: Like most moving averages, RSI-based MAs are lagging indicators. They tend to react after price movements have already begun, which could result in delayed signals.
- **False Signals**: In ranging or highly volatile markets, RSI-based MA may give false signals, indicating a trend reversal or continuation that does not occur.
- **Should Not Be Used Alone**: It's often recommended to use RSI-based MA alongside other technical indicators (like MACD, Bollinger Bands, or moving average crossovers) to confirm signals and reduce the risk of false readings.
### Conclusion
The RSI-based MA can be a powerful tool for traders looking to enhance their understanding of market trends and momentum. By combining RSI with moving averages, traders can smooth out RSI readings and gain a clearer view of the market’s direction. However, as with any indicator, it should be used in conjunction with other tools and strategies to maximize its effectiveness and reduce risk.

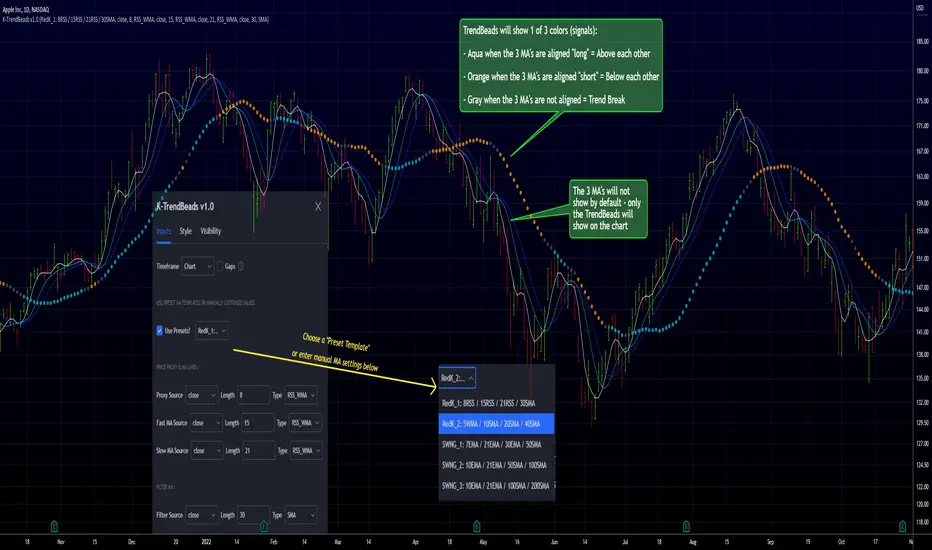
RedK TrendBeads: 3 x MA Crossover Signal with Preset TemplatesRedK TrendBeads is a super simple 3 x Moving Average Crossover Signal (Long/Short/Break) script that provides a simple and effective way for traders to identify potential trading opportunities. By combining three moving averages and only exposing a simple signal, the script helps filter out noise and focus on the trend and the trade execution.
Background
===========
A 3 x Moving Average Crossover strategy is a popular trading method in technical analysis . It uses the relationship between a fast, medium, and slow moving averages to generate buy or sell signals.
The approach usually utilizes three moving averages to track the average price of a financial instrument over different time periods. By comparing the fast, medium, and slow moving averages, we can generates a signal to trade long or short
If the fast moving average crosses above the medium moving average and the medium moving average is above the slow moving average, we have a probability of an up-trend forming, and we generate a signal to go long. Conversely, if the fast moving average crosses below the medium moving average and the medium moving average is below the slow moving average, we have a probability of a down-trend forming, and we generate a signal to go short. When the moving averages are not in the right order (above or below each other), we have a trend break, usually on consolidation or base forming.
in TrendBeads, the fastest MA is called "Price Proxy MA" and will be used with a relatively short length to represent the price itself - then there are the Fast MA, Slow MA and a Filter MA (usually with the longest/slowest length) which is the main line that will be used to plot the TrendBeads - So the TrendBeads will represent the state of the other 3 Moving Average lines (Proxy, Fast and Slow) and how they are aligned - and it will also be common to use the Filter / Beads line itself as a main filter, i.e., take long positions *only* when the price action is above the Filter MA, and short positions *only* when the price is below the Filter MA.
So what is different with TrendBeads:
=====================================
Simplicity, No Clutter: I put this together to provide a super simple mechanism to track trend on the price chart without so much noise as i also wanted to have other top-chart indicators (like LadderTrader) - so TrendBeads only shows the "beads" on the chart - they act like "traffic lights" with little distracting information - Simplicity here was deliberately part if the idea
Presets, What others are Watching: The other feature I needed was the ability to track price action against "different sets" of Moving Averages quickly - for example, when executing short-term trades, I needed to use Moving Averages with shorter length and want to utilize my RSS_WMA MA type - but when assessing big breakout opportunities, I need to analyze price action against a different set of MA's with (usually) longer length and mainly SMA's (hint, The Minervini template) - This is where the built-in Preset Templates become very useful.
Having these preset templates quickly available (thru the dropdown in indicator settings) provides time saving, convenience and the confidence that we're looking at what other traders are using in their analysis - so not missing out on key-level breakouts or reversals
TrendBeads v1.0 includes the following 5 preset MA templates
======================================================
Preset 1 : RedK_1: 8RSS / 15RSS / 21RSS / 30SMA
Preset 2 : RedK_2: 5WMA / 10SMA / 20SMA / 40SMA
Preset 3 : SWNG_1: 7EMA / 21EMA / 30EMA / 50SMA
Preset 4 : SWNG_2: 10EMA / 21EMA / 50SMA / 100SMA
Preset 5 : SWNG_3: 10EMA / 21EMA / 100SMA / 200SMA
The above presets represent some of the most common sets of MA's traders use in various scenarios (Short-term/day trading, Swing, Long term / growth). Well, except for the first one since it utilizes my own RSS_WMA :) which I use in many charts
I may add some more presets in future.
below chart shows an example of different presets against AAPL for the same time range / window
There's also the ability to manually set different MA source price, MA type and length for each of the 4 MA lines. Supported MA types are SMA , EMA , WMA , HMA and my RSS_WMA
TrendBeads Usage Tips:
=====================
*If you have used any MA crossover (2 lines or 3 lines) on your chart, your should find TradeBeads very easy to use. TrendBeads works the same way except that the signal will show as colored beads on the Filter MA line instead of showing multiple crossing lines .. and that is by design.
* Feel free to expose any or all of the individual MA lines - for example, i find that exposing the Proxy Line helps in quickly finding famous chart patterns ( cup & handle , H&S ..etc)
* Experiment with the different presets depending on the type of trade you're working on (swing, long term growth candidates, day trades..etc)
* Note that in a long trend up (Aqua Beads), usually the first gray + orange sequence will usually act as a "reversal sign" - and are usually not actionable - always look for the "second" color sequence to action/trade .. Same thing for a long trend down -- get used to how the beads change color against the trend changes and play with various timeframes.
* As usual - we should have other indicators that track strength, volume , etc and ensure proper confirmation before trade execution - A good signal is only a small part of a trade - risk management and good trade execution are key to winning.
Hope some fellow traders will find this useful - feel free to leave me any comments or feedback - Good luck!
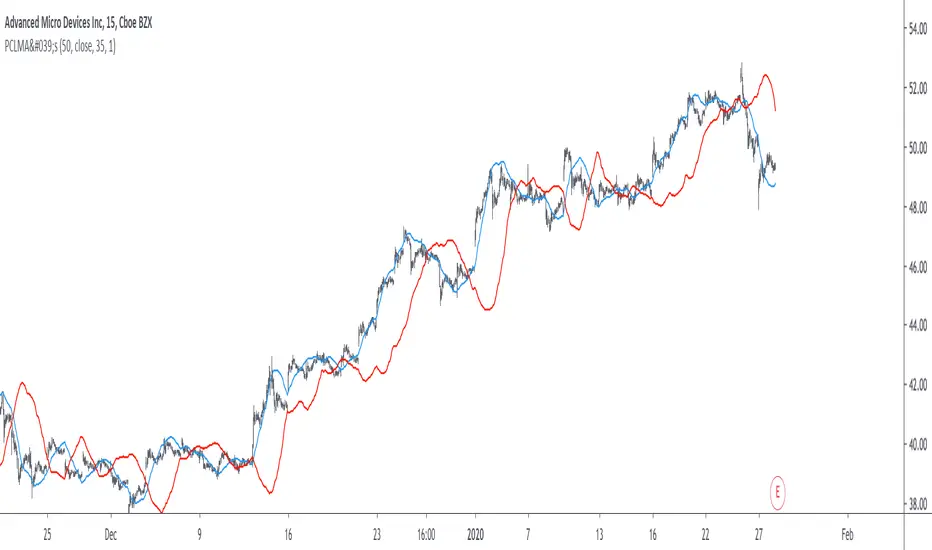
Sequentially Filtered Moving AverageThe previously proposed sequential filter aimed to filter variations lower than a certain period, this allowed to remove noisy variations and retain only the closing price values that occurred after a consecutive up/down, however because of the noisy nature of the closing price large filtering was impossible, in order to tackle to this problem the same indicator using a simple moving average as input is proposed, this allow for smoother results.
We will see that the proposed indicator can provide an alternative moving average that could be used as slow moving average in crossover systems.
The Indicator
The length parameter as the same function as the one described in the sequential filter post, however here length also control the period of the moving average used input, in short larger values of length will return a smoother but less reactive output.
In blue the moving average with length = 200, and in red the moving average with length = 50.
It is interesting to see how the moving average remain flat during ranging/flat market periods
Unfortunately like the sequential filter the sequentially filtered moving average (SFMA) is not affected by large short term variations such as gaps or short term volatile events. This is because of the nature of the sequential filter to ignore movements amplitude and only focus on the variation period.
Moving Average Crossover System
The SFMA is equal to a simple moving average of period length when a consecutive up/down sequence of size length has occurred, else the SFMA is equal to its precedent value, therefore we could expect less crosses between a fast moving average and the SFMA as slow moving average.
We can see on the figure above that the fast moving average of period 50 (in green) cross more with the slow moving average of period 200 (in red) than with the SFMA of period 200 (in blue).
Crosses can occur at the same time as with the classical slow moving average (in red) or a bit later.
Conclusion
A new moving average based on the recently proposed sequential filter has been proposed, it can be seen that under a moving average crossover system the proposed moving average seems to be more effective at producing less crosses without necessarily doing it with an excessive lag, in fact the moving average has either lag (length-1)/2 or lag length .
In the future it could be interesting to provide an hybrid alternative that take into account volatility as well as variations period.
Thanks for reading !

Parametric Corrective Linear Moving AveragesImpulse responses can fully describe their associated systems, for example a linearly weighted moving average (WMA) has a linearly decaying impulse response, therefore we can deduce that lag is reduced since recent values are the ones with the most weights, the Blackman moving average (or Blackman filter) has a bell shaped impulse response, that is mid term values are the ones with the most weights, we can deduce that such moving average is pretty smooth, the least squares moving average has negative weights, we can therefore deduce that it aim to heavily reduce lag, and so on. We could even estimate the lag of a moving average by looking at its impulse response (calculating the lag of a moving average is the aim of my next article with Pinescripters) .
Today a new moving average is presented, such moving average use a parametric rectified linear unit function as weighting function, we will see that such moving average can be used as a low lag moving average as well as a signal moving average, thus creating a moving average crossover system. Finally we will estimate the LSMA using the proposed moving average.
Correctivity And The Parametric Rectified Linear Unit Function
Lot of terms are used, each representing one thing, lets start with the easiest one,"corrective". In some of my posts i may have used the term "underweighting", which refer to the process of attributing negative weights to the input of a moving average, a corrective moving average is simply a moving average underweighting oldest values of the input, simply put most of the low lag moving averages you'll find are corrective. This term was used by Aistis Raudys in its paper "Optimal Negative Weight Moving Average for Stock Price Series Smoothing" and i felt like it was a more elegant term to use instead of "low-lag".
Now we will describe the parametric rectified linear unit function (PReLU), this function is the one used as weighting function and is not that complex. This function has two inputs, alpha , and x , in short if x is greater than 0, x remain unchanged, however if x is lower than 0, then the function output is alpha × x , if alpha is equal to 1 then the function is equivalent to an identity function, if alpha is equal to 0 then the function is equivalent to a rectified unit function.
PReLU is mostly used in neural network design as an activation function, i wont explain to you how neural networks works but remember that neural networks aim to mimic the neural networks in the brain, and the activation function mimic the process of neuron firing. Its a super interesting topic because activation functions regroup many functions that can be used for technical indicators, one example being the inverse fisher RSI who make use of the hyperbolic tangent function.
Finally the term parametric used here refer to the ability of the user to change the aspect of the weighting function thanks to certain settings, thinking about it, it isn't a common things for moving averages indicators to let the user modify the characteristics of the weighting function, an exception being the Arnaud Legoux moving average (ALMA) which weighting function is a gaussian function, the user can control the peak and width of the function.
The Indicator
The indicator has two moving averages displayed on the chart, a trigger moving average (in blue) and a signal moving average (in red), their crosses can generate signals. The length parameter control the filter length, with higher values of length filtering longer term price fluctuations.
The percentage of negative weights parameter aim to determine the percentage of negative weights in the weighting function, note that the signal moving average won't use the same amount and will use instead : 100 - Percentage , this allow to reverse the weighting function thus creating a more lagging output for signal. Note that this parameter is caped at 50, this is because values higher than 50 would make the trigger moving average become the signal moving average, in short it inverse the role of the moving averages, that is a percentage of 25 would be the same than 75.
In red the moving average using 25% of negative weights, in blue the same moving average using 14% percent of negative weights. In theory, more negative weights = less lag = more overshoots.
Here the trigger MA in blue has 0% of negative weights, the trigger MA in green has however 35% of negative weights, the difference in lag can be clearly seen. In the case where there is 0% of negative weights the trigger become a simple WMA while the signal one become a moving average with linearly increasing weights.
The corrective factor is the same as alpha in PReLU, and determine the steepness of the negative weights line, this parameter is constrained in a range of (0,1), lower values will create a less steep negative weights line, this parameter is extremely useful when we want to reduce overshoots, an example :
here the corrective factor is equal to 1 (so the weighting function is an identity function) and we use 45% of negative weights, this create lot of overshoots, however a corrective factor of 0.5 reduce them drastically :
Center Of Linearity
The impulse response of the signal moving average is inverse to the impulse response of the trigger moving average, if we where to show them together we would see that they would crosses at a point, denoted center of linearity, therefore the crosses of each moving averages correspond to the cross of the center of linearity oscillator and 0 of same period.
This is also true with the center of gravity oscillator, linear covariance oscillator and linear correlation oscillator. Of course the center of linearity oscillator is way more efficient than the proposed indicator, and if a moving average crossover system is required, then the wma/sma pair is equivalent and way more efficient, who would know that i would propose something with more efficient alternatives ? xD
Estimating A Least Squares Moving Average
I guess...yeah...but its not my fault you know !!! Its a linear weighting function ! What can i do about it ?
The least squares moving average is corrective, its weighting function is linearly decreasing and posses negative weights with an amount of negative weights inferior to 50%, now we only need to find the exact percentage amount of negative weights. How to do it ? Well its not complicated if we recall the estimation with the WMA/SMA combination.
So, an LSMA of period p is equal to : 3WMA(p) - 2SMA(p) , each coefficient of the combination can give us this percentage, that is 2/3*100 = 33.333 , so there are 33.33% percent of negative weights in the weighting function of the least squares moving average.
In blue the trigger moving average with percentage of negative values et to 33.33, and in green the lsma of both period 50.
Conclusion
Altho inefficient, the proposed moving averages remain extremely interesting. They make use of the PReLU function as weighting function and allow the user to have a more accurate control over the characteristics of the moving averages output such as lag and overshoot amount, such parameters could even be made adaptive.
We have also seen how to estimate the least squares moving average, we have seen that the lsma posses 33.333...% of negative weights in its weighting function, another useful information.
The lsma is always behind me, not letting me focus on cryptobot super profit indicators using massive amount of labels, its like each time i make an indicator, the lsma come back, like a jealous creature, she want the center of attention, but you know well that the proposed indicator is inefficient ! Inefficient elegance (effect of the meds) .
Thanks for reading !
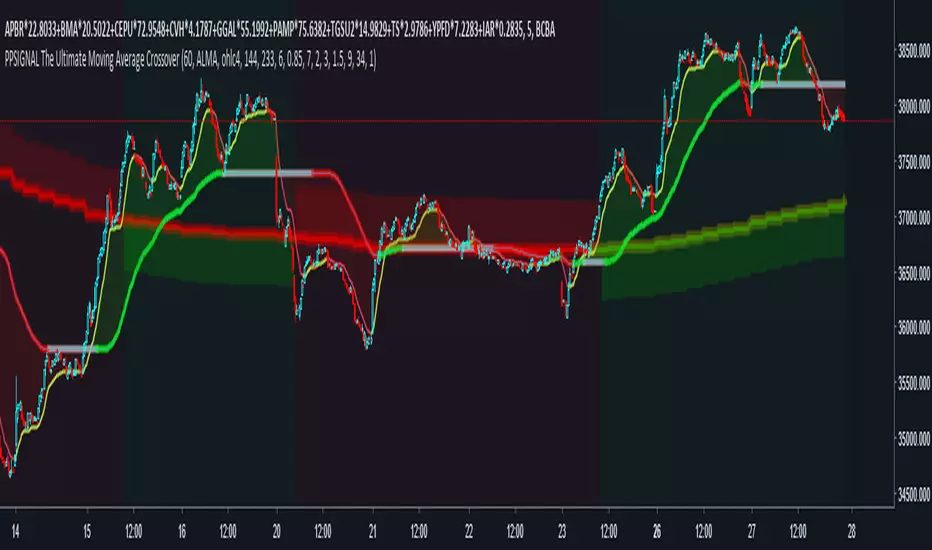
PpSignal The Ultimate Moving Average CrossoverNo matter how many times I explore new concepts, I tend to always incorporate a moving average, or two (if not on price, then on an oscillator). I am going to show the settings I have found to be most beneficial for finding the trend for the ES, forex, crypto etc. First, I have to admit, it is not just a simple crossover. Instead, it is a combination of a MA cross, Multi-Time Frame (MTF), and direction of a normalized moving average.
Universal Scalper Indicator [Crypto/Forex/Gold]Universal Scalper Pro is an all-in-one scalping system designed for the 15-Minute Timeframe. It automates the analysis of trend, volatility, and risk management into a single, high-contrast dashboard.
Unlike standard crossover indicators, this system filters out low-volatility "noise" using a built-in ADX engine and automatically calculates dynamic Stop Loss and Take Profit levels based on market volatility (ATR).
It is engineered to work universally on:
Crypto (BTC, ETH, SOL, Altcoins)
Commodities (Gold, Silver, Oil)
Forex (Major & Minor Pairs)
Stocks (High volume tech stocks like NVDA, TSLA)
📈 How It Works (The Strategy)
1. The Trend Engine (9/21 EMA) The core logic utilizes a Fast (9) and Slow (21) Exponential Moving Average crossover.
Bullish Signal: The 9 EMA crosses above the 21 EMA.
Bearish Signal: The 9 EMA crosses below the 21 EMA. This specific combination is chosen for its responsiveness to 15-minute intraday trends.
2. The Noise Filter (ADX > 15) To prevent "whipsaws" (fake signals during sideways markets), the script includes a Volatility Filter based on the Average Directional Index (ADX).
Signals are rejected if the ADX is below 15.
This ensures you only receive alerts when there is sufficient momentum to sustain a move.
3. Dynamic Risk Management (ATR) The script uses the Average True Range (ATR) to calculate Stop Loss and Take Profit levels that adapt to the specific asset's volatility.
Stop Loss: Placed at 1.5x ATR from the entry. (Tight enough to preserve capital, wide enough to survive standard market noise).
Take Profit: Placed at 2.0x ATR from the entry. (Provides a healthy 1:1.3 Risk/Reward ratio).
🚀 Key Features
Universal Dashboard: A bottom-right panel displays the live Trend Status, Entry Price, Stop Loss, and Take Profit. It automatically formats decimals for any asset (e.g., 2 decimals for Gold, 5 for Forex, 8 for Crypto).
"Sticky" Memory: The dashboard retains the prices of the last valid signal, allowing you to manage your trade even after the signal candle closes.
Trend Cloud: A visual Green/Red zone between the EMAs helps you instantly identify the market bias.
Unified Alerts: A single alert setup ("Any alert() function call") sends the Asset Name, Entry, SL, and TP directly to your phone.
🛠️ How to Use
Timeframe: Set your chart to 15 Minutes (15m).
Wait for the Signal: Look for the "BUY" (Green) or "SELL" (Red) label on the chart.
Check the Dashboard: Ensure the "STATUS" is BULLISH (for buys) or BEARISH (for sells). If the status says "WAIT", do not trade.
Execute: Enter the trade using the exact Stop Loss and Take Profit levels shown on the dashboard.
⚠️ Risk Disclaimer
Trading financial markets involves high risk and may not be suitable for all investors. This indicator is a technical analysis tool and does not constitute financial advice. Past performance is not indicative of future results. Always practice with a demo account before trading real capital.

7/21 EMA ADX Pro After many months (actually years) of intense research, countless hours of testing different approaches, and rigorous backtesting, I’ve finally developed this indicator/strategy based on moving average crossovers enhanced with power-based filtering to significantly reduce false signals and whipsaws. This is not just another basic MA crossover system. The core idea revolves around applying mathematical powers (exponents) to the moving averages and combining them with additional confirmation filters, creating a much more robust and reliable signal generation mechanism. I’m sharing it with the community in the hope that it can be useful to someone else who, like me, has spent endless nights trying to find an edge in the markets. Feel free to test it, modify it, or improve it. Feedback, suggestions, and constructive criticism are always welcome. If you find it helpful, a simple like or comment would mean a lot — it’s the result of a huge amount of work and passion. Happy trading! (Full Pine Script code will be posted below or in the next update — stay tuned!

CVD Strength | VTS Pro🔷 CVD Strength | VTS Pro
By Alireza Mossaheb
Description:
CVD Strength is a powerful tool designed to analyze market momentum by visualizing the Cumulative Volume Delta (CVD) using advanced techniques. This indicator provides a multi-timeframe view of volume delta behavior and highlights strong and weak bullish/bearish conditions based on volume spikes, candle size, and optional moving average filters.
Key Features:
Multi-timeframe CVD candle plotting with color-coded strength signals
Optional EMA (21), WMA (30), and SMA (50) overlays for trend filtering
Smart strength detection logic using volume, candle size, and moving average crossovers
Bullish and bearish crossover signals marked on chart
Customizable anchor and lower timeframes for flexible analysis
Alerts users when data vendor does not supply volume information
This script is particularly useful for identifying institutional buying/selling pressure and can be used effectively in both trend-following and mean-reversion strategies.

TMO (True Momentum Oscillator)TMO ((T)rue (M)omentum (O)scilator)
Created by Mobius V01.05.2018 TOS Convert to TV using Claude 3.7 and ChatGPT 03 Mini :
TMO calculates momentum using the delta of price. Giving a much better picture of trend, tend reversals and divergence than momentum oscillators using price.
True Momentum Oscillator (TMO)
The True Momentum Oscillator (TMO) is a momentum-based technical indicator designed to identify trend direction, trend strength, and potential reversal points in the market. It's particularly useful for spotting overbought and oversold conditions, aiding traders in timing their entries and exits.
How it Works:
The TMO calculates market momentum by analyzing recent price action:
Momentum Calculation:
For a user-defined length (e.g., 14 bars), TMO compares the current closing price to past open prices. It assigns:
+1 if the current close is greater than the open price of the past bar (indicating bullish momentum).
-1 if it's less (indicating bearish momentum).
0 if there's no change.
The sum of these scores gives a raw momentum measure.
EMA Smoothing:
To reduce noise and false signals, this raw momentum is smoothed using Exponential Moving Averages (EMAs):
First, the raw data is smoothed by an EMA over a short calculation period (default: 5).
Then, it undergoes additional smoothing through another EMA (default: 3 bars), creating the primary "Main" line of the indicator.
Lastly, a "Signal" line is derived by applying another EMA (also default: 3 bars) to the main line, adding further refinement.
Trend Identification:
The indicator plots two lines:
Main Line: Indicates current momentum strength and direction.
Signal Line: Acts as a reference line, similar to a moving average crossover system.
When the Main line crosses above the Signal line, it suggests strengthening bullish momentum. Conversely, when the Main line crosses below the Signal line, it indicates increasing bearish momentum.
Overbought/Oversold Levels:
The indicator identifies key levels based on the chosen length parameter:
Overbought zone (positive threshold): Suggests the market might be overheated, and a potential bearish reversal or pullback could occur.
Oversold zone (negative threshold): Suggests the market might be excessively bearish, signaling a potential bullish reversal.
Clouds visually mark these overbought/oversold areas, making it easy to see potential reversal zones.
Trading Applications:
Trend-following: Traders can enter positions based on crossovers of the Main and Signal lines.
Reversals: The overbought and oversold areas highlight high-probability reversal points.
Momentum confirmation: Use TMO to confirm price action or other technical signals, improving trade accuracy and timing.
The True Momentum Oscillator provides clarity in identifying momentum shifts, making it a valuable addition to various trading strategies.

Exposure Oscillator (Cumulative 0 to ±100%)
Exposure Oscillator (Cumulative 0 to ±100%)
This Pine Script indicator plots an "Exposure Oscillator" on the chart, which tracks the cumulative market exposure from a range of technical buy and sell signals. The exposure is measured on a scale from -100% (maximum short exposure) to +100% (maximum long exposure), helping traders assess the strength of their position in the market. It provides an intuitive visual cue to aid decision-making for trend-following strategies.
Buy Signals (Increase Exposure Score by +10%)
Buy Signal 1 (Cross Above 21 EMA):
This signal is triggered when the price crosses above the 21-period Exponential Moving Average (EMA), where the current bar closes above the EMA21, and the previous bar closed below the EMA21. This indicates a potential upward price movement as the market shifts into a bullish trend.
buySignal1 = ta.crossover(close, ema21)
Buy Signal 2 (Trending Above 21 EMA):
This signal is triggered when the price closes above the 21-period EMA for each of the last 5 bars, indicating a sustained bullish trend. It confirms that the price is consistently above the EMA21 for a significant period.
buySignal2 = ta.barssince(close <= ema21) > 5
Buy Signal 3 (Living Above 21 EMA):
This signal is triggered when the price has closed above the 21-period EMA for each of the last 15 bars, demonstrating a strong, prolonged uptrend.
buySignal3 = ta.barssince(close <= ema21) > 15
Buy Signal 4 (Cross Above 50 SMA):
This signal is triggered when the price crosses above the 50-period Simple Moving Average (SMA), where the current bar closes above the 50 SMA, and the previous bar closed below it. It indicates a shift toward bullish momentum.
buySignal4 = ta.crossover(close, sma50)
Buy Signal 5 (Cross Above 200 SMA):
This signal is triggered when the price crosses above the 200-period Simple Moving Average (SMA), where the current bar closes above the 200 SMA, and the previous bar closed below it. This suggests a long-term bullish trend.
buySignal5 = ta.crossover(close, sma200)
Buy Signal 6 (Low Above 50 SMA):
This signal is true when the lowest price of the current bar is above the 50-period SMA, indicating strong bullish pressure as the price maintains itself above the moving average.
buySignal6 = low > sma50
Buy Signal 7 (Accumulation Day):
An accumulation day occurs when the closing price is in the upper half of the daily range (greater than 50%) and the volume is larger than the previous bar's volume, suggesting buying pressure and accumulation.
buySignal7 = (close - low) / (high - low) > 0.5 and volume > volume
Buy Signal 8 (Higher High):
This signal occurs when the current bar’s high exceeds the highest high of the previous 14 bars, indicating a breakout or strong upward momentum.
buySignal8 = high > ta.highest(high, 14)
Buy Signal 9 (Key Reversal Bar):
This signal is generated when the stock opens below the low of the previous bar but rallies to close above the previous bar’s high, signaling a potential reversal from bearish to bullish.
buySignal9 = open < low and close > high
Buy Signal 10 (Distribution Day Fall Off):
This signal is triggered when a distribution day (a day with high volume and a close near the low of the range) "falls off" the rolling 25-bar period, indicating the end of a bearish trend or selling pressure.
buySignal10 = ta.barssince(close < sma50 and close < sma50) > 25
Sell Signals (Decrease Exposure Score by -10%)
Sell Signal 1 (Cross Below 21 EMA):
This signal is triggered when the price crosses below the 21-period Exponential Moving Average (EMA), where the current bar closes below the EMA21, and the previous bar closed above it. It suggests that the market may be shifting from a bullish trend to a bearish trend.
sellSignal1 = ta.crossunder(close, ema21)
Sell Signal 2 (Trending Below 21 EMA):
This signal is triggered when the price closes below the 21-period EMA for each of the last 5 bars, indicating a sustained bearish trend.
sellSignal2 = ta.barssince(close >= ema21) > 5
Sell Signal 3 (Living Below 21 EMA):
This signal is triggered when the price has closed below the 21-period EMA for each of the last 15 bars, suggesting a strong downtrend.
sellSignal3 = ta.barssince(close >= ema21) > 15
Sell Signal 4 (Cross Below 50 SMA):
This signal is triggered when the price crosses below the 50-period Simple Moving Average (SMA), where the current bar closes below the 50 SMA, and the previous bar closed above it. It indicates the start of a bearish trend.
sellSignal4 = ta.crossunder(close, sma50)
Sell Signal 5 (Cross Below 200 SMA):
This signal is triggered when the price crosses below the 200-period Simple Moving Average (SMA), where the current bar closes below the 200 SMA, and the previous bar closed above it. It indicates a long-term bearish trend.
sellSignal5 = ta.crossunder(close, sma200)
Sell Signal 6 (High Below 50 SMA):
This signal is true when the highest price of the current bar is below the 50-period SMA, indicating weak bullishness or a potential bearish reversal.
sellSignal6 = high < sma50
Sell Signal 7 (Distribution Day):
A distribution day is identified when the closing range of a bar is less than 50% and the volume is larger than the previous bar's volume, suggesting that selling pressure is increasing.
sellSignal7 = (close - low) / (high - low) < 0.5 and volume > volume
Sell Signal 8 (Lower Low):
This signal occurs when the current bar's low is less than the lowest low of the previous 14 bars, indicating a breakdown or strong downward momentum.
sellSignal8 = low < ta.lowest(low, 14)
Sell Signal 9 (Downside Reversal Bar):
A downside reversal bar occurs when the stock opens above the previous bar's high but falls to close below the previous bar’s low, signaling a reversal from bullish to bearish.
sellSignal9 = open > high and close < low
Sell Signal 10 (Distribution Cluster):
This signal is triggered when a distribution day occurs three times in the rolling 7-bar period, indicating significant selling pressure.
sellSignal10 = ta.valuewhen((close < low) and volume > volume , 1, 7) >= 3
Theme Mode:
Users can select the theme mode (Auto, Dark, or Light) to match the chart's background or to manually choose a light or dark theme for the oscillator's appearance.
Exposure Score Calculation: The script calculates a cumulative exposure score based on a series of buy and sell signals.
Buy signals increase the exposure score, while sell signals decrease it. Each signal impacts the score by ±10%.
Signal Conditions: The buy and sell signals are derived from multiple conditions, including crossovers with moving averages (EMA21, SMA50, SMA200), trend behavior, and price/volume analysis.
Oscillator Visualization: The exposure score is visualized as a line on the chart, changing color based on whether the exposure is positive (long position) or negative (short position). It is limited to the range of -100% to +100%.
Position Type: The indicator also indicates the position type based on the exposure score, labeling it as "Long," "Short," or "Neutral."
Horizontal Lines: Reference lines at 0%, 100%, and -100% visually mark neutral, increasing long, and increasing short exposure levels.
Exposure Table: A table displays the current exposure level (in percentage) and position type ("Long," "Short," or "Neutral"), updated dynamically based on the oscillator’s value.
Inputs:
Theme Mode: Choose "Auto" to use the default chart theme, or manually select "Dark" or "Light."
Usage:
This oscillator is designed to help traders track market sentiment, gauge exposure levels, and manage risk. It can be used for long-term trend-following strategies or short-term trades based on moving average crossovers and volume analysis.
The oscillator operates in conjunction with the chart’s price action and provides a visual representation of the market’s current trend strength and exposure.
Important Considerations:
Risk Management: While the exposure score provides valuable insight, it should be combined with other risk management tools and analysis for optimal trading decisions.
Signal Sensitivity: The accuracy and effectiveness of the signals depend on market conditions and may require adjustments based on the user’s trading strategy or timeframe.
Disclaimer:
This script is for educational purposes only. Trading involves significant risk, and users should carefully evaluate all market conditions and apply appropriate risk management strategies before using this tool in live trading environments.

MTFHTS with Moving Average Ribbon and Buy/Sell Signals 3.2Multi-Timeframe Moving Average Strategy with Buy and Sell Signals
Purpose
This strategy is designed to provide clear, data-driven buy and sell signals based on moving average crossovers across multiple timeframes. It aims to help traders identify potential trend reversals and entry/exit points using a systematic approach.
How it Works
Moving Averages Across Multiple Timeframes:
Five customizable moving averages (MA №1 to MA №5) are calculated using different lengths and types, including SMA, EMA, WMA, and VWMA, to suit various trading styles.
The MAs are plotted on different timeframes, allowing traders to visualize trend alignment and identify market momentum across short, medium, and long terms.
Signals for Buying and Selling:
Buy Signals: When the shorter-term MA (MA №1) crosses above a longer-term MA (MA №2 or MA №3), the strategy triggers a buy signal, indicating potential upward momentum.
Sell Signals: When MA №1 crosses below a longer-term MA (MA №2 or MA №3), a sell signal is triggered, suggesting potential downward movement.
Visual Aids and Alerts:
The strategy uses color fills between MAs to indicate bullish (green) or bearish (red) trends, helping traders assess market conditions at a glance.
Alerts for buy and sell signals keep traders notified in real-time, helping to avoid missed opportunities.
Important Note
This strategy is purely educational and does not constitute investment advice. It serves as a tool to help traders understand how multi-timeframe moving averages and crossovers can be used in technical analysis. As with any trading strategy, we recommend testing in a simulated environment and exercising caution.